모니터링 - LGTM!
개요
https://github.com/grafana https://grafana.com/docs/grafana/latest/
garafana labs 에서 제공하는 Observability 를 제공하기 위한 대표 프로젝트 4가지
- Loki, like Prometheus, but for logs.
- Grafana, the open and composable observability and data visualization platform.
- Tempo, a high volume, minimal dependency distributed tracing backend.
- Mimir, the most scalable Prometheus metric backend.
Mimir 를 제외하고 각 프로젝트별로 k8s helm 기반으로 동작할 수 있도록 문서화가 잘 되어있다.
설치시 사용한 버전에 따라 설정값이 달라질 수 있지만 각 프로젝트별 컴포넌트를 확인하고 연결해야할 부분만 정확히 파악한다면 학습을 위한 설치는 쉽게 가능하다.
Loki
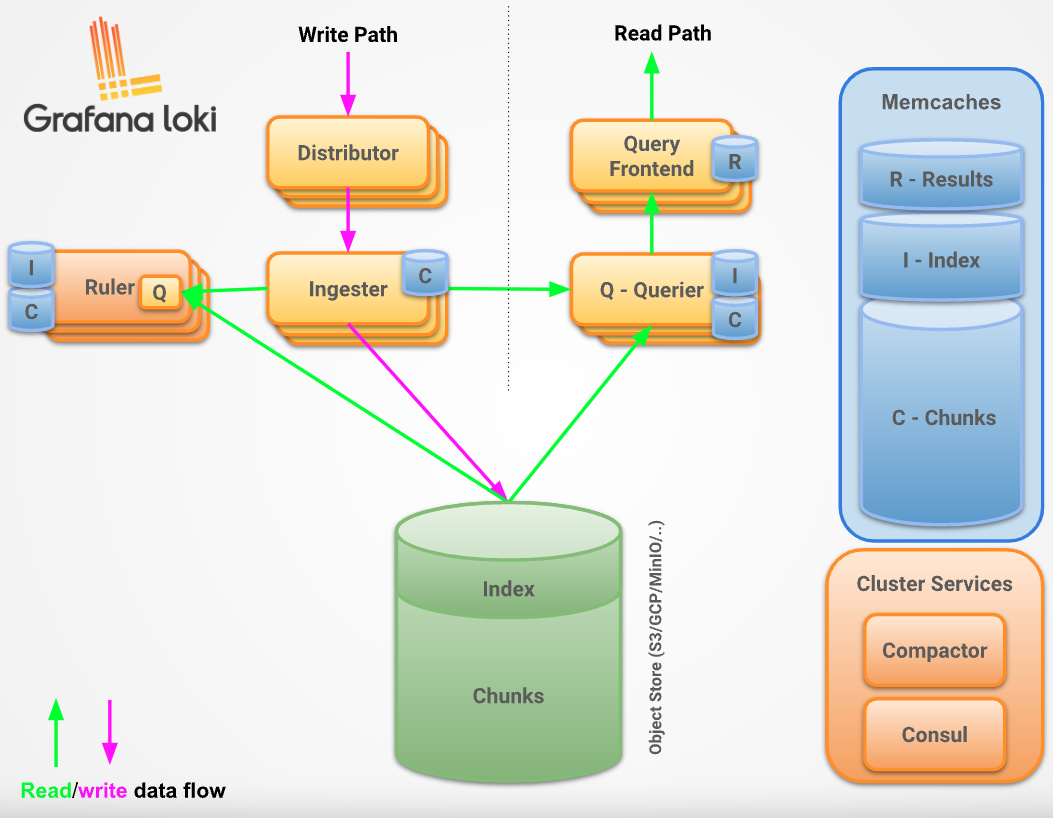
Loki 는 어플리케이션 규모에 따라 read/write 비율이 극단적으로 달라질 수 있는 백엔드 서비스로,
각 기능별로 MSA 형태로 동작하며 분할 및 수평확장을 지원한다.
그림과 같이 8개의 컴포넌트로 나뉘며 각 컴포넌트를 뭉쳐 [write, read, backend] 서비스 형태로 운영하는 방식을 많이 사용한다.
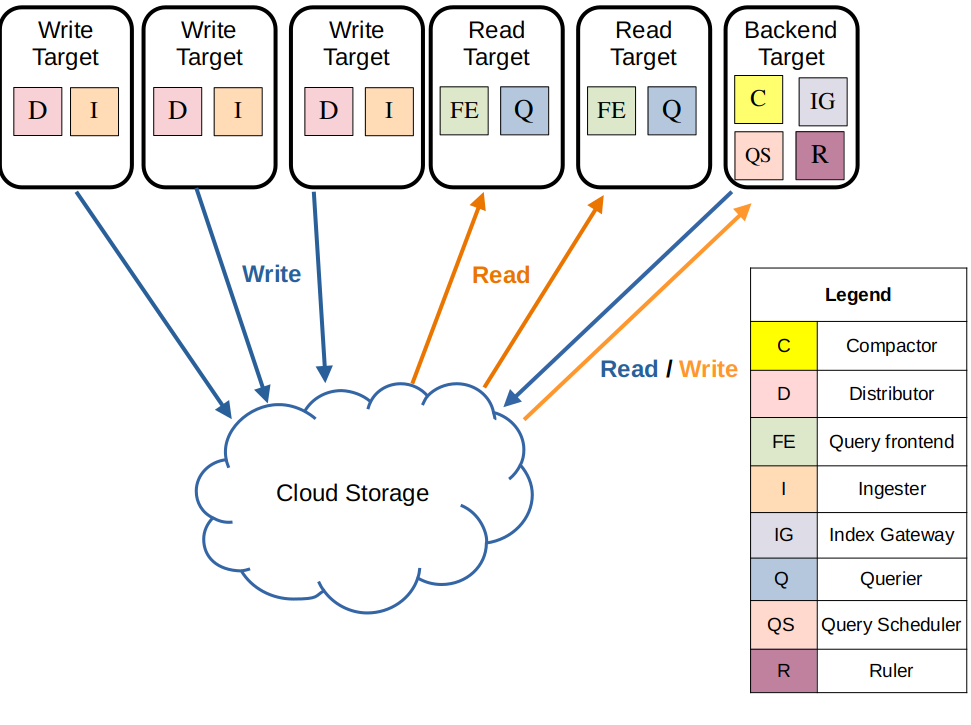
read service 의 경우 Ingester 와 ObjectStorage 에 저장되어 있는 로그데이터를 검색만 하기에 stateless 하지만,
write service, backend service 의 경우 Ingester 와 Compactor 가 chunk 단위로 로그데이터를 저장하거나 압축하는 과정이 있어 내부에 일부 로그를 저장하는 공간이 필요하기에 stateful 하다.
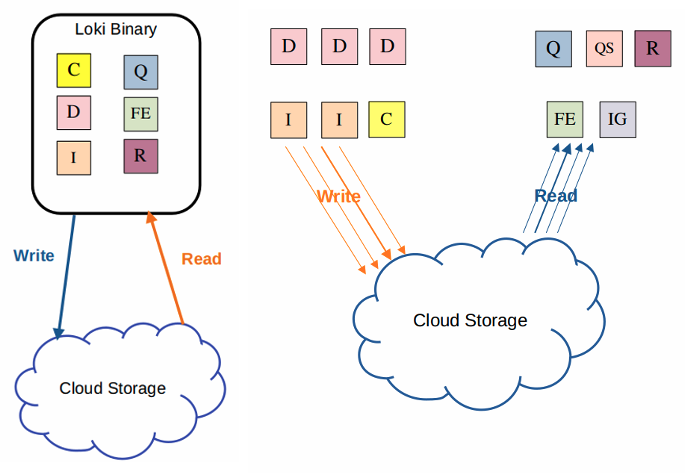
아래 그림과 같이 완전 [모노리틱 모드, 마이크로서비스 모드]로 운영 가능하다.
각 서비스는 8개의 컴포넌트로 구성되며 주요 컴포넌트은 아래와 같다.
-
Compactor(압축기)
테이블을 단일 인덱스 파일로 압축, 전체 인덱스를 탐색하여 중복을 제거 후 디스크의 파일에 저장, 새로 수정된 색인 파일을 업로드, 보존 설정에 따라 데이터를 삭제 및 보존처리. -
Distributor(분배기)
들어오는 로그 스트림의 첫번째 입구, 각 로그 스트림의 정확성, 권한(tenent) 체크 후 chunk 단위로 Ingester 에게 전달. -
Ingester(수집기)
장기 스토리지 백엔드(DynamoDB, S3 등)에 로그데이터를 쓰고, 장기 스토리지로 저장되기 전 in-memory 읽기쿼리 요청을 처리하기도 함. -
Ruler(규칙기)
Loki가 수집한 로그 데이터를 기반으로 경고를 생성하는 일을 담당
[write, read] 서비스는 여러 컴포넌트를 거치며 흐름은 아래 그림과 같다.
데모용, docker compose 기반 설치
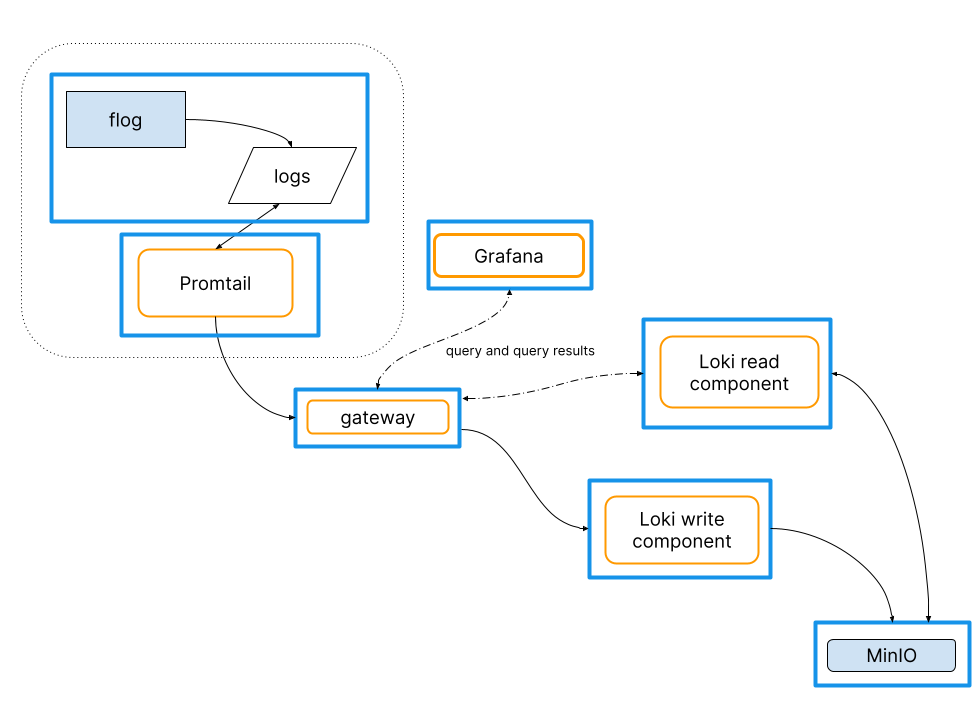
flog is a fake log generator for common log formats such as apache-common, apache error and RFC3164 syslog.
https://github.com/mingrammer/flog
- flog: fake log generator
- promtail(log ship agent)
- gateway(nginx)
- grafana
- loki(read, write)
- minio(object storage)
loki 문서에서 docker-compose 기반으로 위 그림과 같이 로그를 저장하는 코드를 작성해두었다.
Helm 기반 설치
https://grafana.com/docs/loki/latest/setup/install/helm/
https://grafana.com/docs/loki/latest/setup/install/helm/install-scalable/
https://github.com/grafana/loki/tree/main/production/helm/loki
helm repo add grafana https://grafana.github.io/helm-charts
helm search repo grafana

# 압축파일 다운로드, loki-5.42.0.tgz 버전 설치됨
helm fetch grafana/loki

# 압축 파일 해제
tar zxvf loki-*.tgz
mv loki loki-helm
# self-monitoring 미사용
test:
  # ...
  enabled: false

monitoring:
  # ...
  selfMonitoring:
    enabled: false

loki:
  # ...
  # Should authentication be enabled
  auth_enabled: false
  # ...
  storage:
    bucketNames:
      chunks: chunks
      ruler: ruler
      admin: admin
    type: s3
    s3:
      s3: null
      endpoint: http://minio.minio.svc.cluster.local:9000/loki
      region: null
      secretAccessKey: rootpass123
      accessKeyId: rootuser
      signatureVersion: null
      s3ForcePathStyle: true
      insecure: true
      http_config: {}

# 각 서비스별 replicas 수는 모두 1로 고정
read:
  # ...
  replicas: 1
  persistence:
    # -- Enable StatefulSetAutoDeletePVC feature
    enableStatefulSetAutoDeletePVC: false

write:
  # ...
  replicas: 1
  persistence:
    # -- Enable volume claims in pod spec
    volumeClaimsEnabled: false

backend:
  # ...
  replicas: 1
  persistence:
    # -- Enable volume claims in pod spec
    volumeClaimsEnabled: false
mionio 를 s3 대신 사용할 경우 위와같이 uri 기반으로 bucket 이름을 설정해야함.
Thanos
이번 포스팅에선 아직까지는 Mimir 보다 성숙하고 커뮤니티가 활성화된 Thanos 설치를 진행한다.
https://github.com/thanos-io/thanos
https://thanos.io/tip/thanos/getting-started.md/
https://thanos.io/tip/thanos/quick-tutorial.md/기존
HA Prometheus솔루션으로[Thanos, Cortex]가 존재했었는데,Mimir의 경우Cortex에서 포크되어 추가개발되었다고 할 수 있다.
3개 프로젝트의 구조, 운영방법 모두 유사하다.
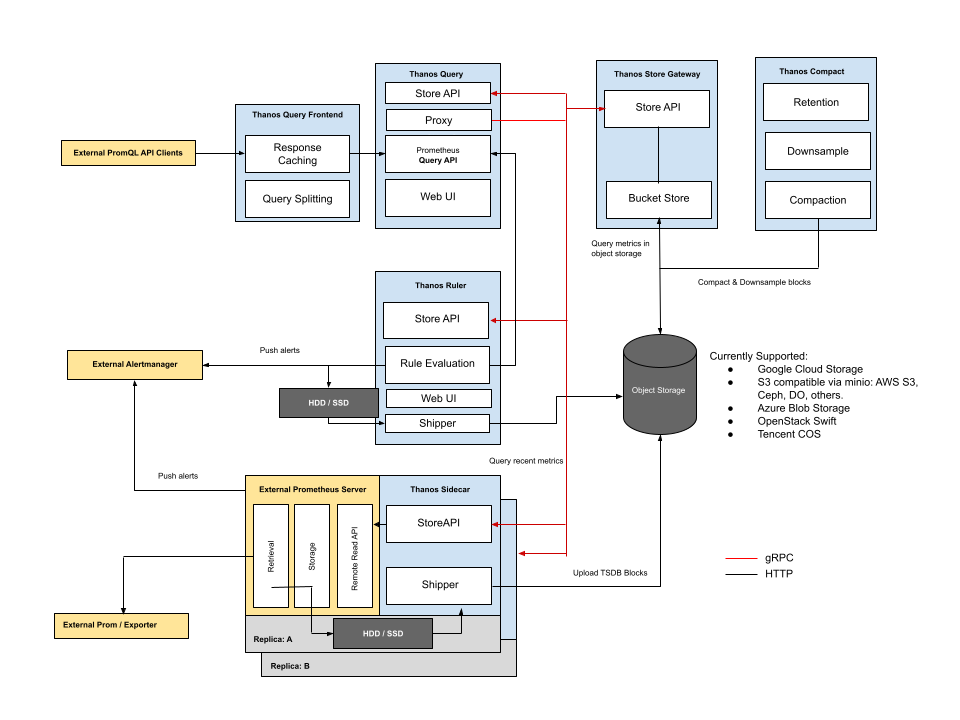
대용량 시계열 데이터 처리를 위해 여러 컴포넌트가 MSA 형태로 운영된다.
- Query Frontend: 메트릭 조회 프론트엔드
- Query: 메트릭 조회
- Ruler: prometheus alert manager 연동
- Store gateway: 장기 메트릭 데이터 관리
- Compact: 장기 메트릭 데이터 압축
- Receiver: 프로메테우스로부터 메트릭 정보 수집(선택사항)
그림처럼 각 레플리카에 배포된 Prometheus 서버에서 Thanos Sidecar 를 설치하고, 아직 Object Storage 에 저장되지 못한 메트릭 데이터들을 조회하거나, 장기보관을 위해 청크단위 메트릭 데이터를 Object Storage 로 옮기는 역할을 수행한다.
Thanos Sidecar구조를 사용할수 없는 경우Thanos Receiver컴포넌트를 사용해서 메트릭 정보를 수신받아Thanos에서 중앙관리하는 방법을 사용할 수 도 있다.
prometheus-community 설치
Thanos 는 Prometheus 를 기반으로 동작한다.
Prometheus 의 helm 차트에서도 파드에서 Thanos Sidecar 를 운영할 수 있도로 지원해준다.
Thanos Sidecar 설치까지 지원하는 prometheus-community helm 차트를 설치.
# prometheus 공식 repo
helm repo add prometheus-community https://prometheus-community.github.io/helm-charts
helm search repo prometheus-community

# 압축파일 다운로드, kube-prometheus-stack-56.4.0.tgz 버전 설치됨
helm fetch prometheus-community/kube-prometheus-stack

# 압축 파일 해제
tar zxvf kube-prometheus-stack-*.tgz
mv kube-prometheus-stack kube-prometheus-stack-helm
그리고 Thanos Sidecar 에서 메트릭 데이터를 직접 ObjectStorage 에 넣기 때문에 연결 설정이 필요하다.
미리 생성해둔 minio 서비스를 사용
objstore.yml파일명 고정 필수
# objstore.yml
type: s3
config:
  bucket: thanos
  endpoint: minio.minio.svc.cluster.local:9000
  access_key: rootuser
  secret_key: rootpass123
  insecure: true
kubectl create secret generic thanos-objstore-secret --from-file=objstore.yml -n prometheus
prometheus-community helm 차트에서 Thanos 를 사용하기 위한 설정 진행.
# values.yaml
prometheus:
  prometheusSpec:
    # ...
    enableRemoteWriteReceiver: true # 외부에서 들어오는 remote_write를 허용
    # ...
    thanos:
      objectStorageConfig:
        existingSecret:
          name: "thanos-objstore-secret"
          key: "objstore.yml"
  thanosService:
    enabled: true
위와 같이 설정후 실행시키면 Thanos sidecar 와 같이 실행된다.
파드에서 아래 3개의 컨테이너 동작중 확인.
kubectl create namespace prometheus
helm install prometheus -f values.yaml . -n prometheus

kubectl get pod/prometheus-prometheus-kube-prometheus-prometheus-0 -n prometheus  -o=jsonpath='{.spec.containers[*].name}' | tr ' ' '\n'
# prometheus
# config-reloader
# thanos-sidecar
실행 후 Thanos Ruler 에서 사용하는 Prometheus AlertManager 서비스,
Thanos Query 에서 사용하는 Prometheus Thanos Discovery 서비스가 동작중인지 확인.
Thanos 설치
https://github.com/bitnami/charts/tree/main/bitnami/thanos
https://devocean.sk.com/blog/techBoardDetail.do?ID=163458
https://wlsdn3004.tistory.com/30
현재 Thanos 에서 직접 배포하는 helm 차트는 존재하지 않는다.
bitnami 에서 배포하는 Thanos helm 차트가 가장 인기가 많다.
Thanos 헬름차트에선 변경할게 많지만 처음 그림의 컴포넌트 구성대로 설정하면 쉽게 설치 가능하다.
해당 서비스에서도 ObjectStorage 연결을 위한 설정이 필요함으로 연결을 위한 Secret 설정.
# objstore.yml
type: s3
config:
  bucket: thanos
  endpoint: minio.minio.svc.cluster.local:9000
  access_key: rootuser
  secret_key: rootpass123
  insecure: true
kubectl create secret generic thanos-objstore-secret --from-file=objstore.yml -n thanos
value.yaml 을 보면 대부분의 컴포넌트가 enabled: false 처리되어 있다.
위 prometheus-community 에서 Thanos Sidecar 방식을 사용할 것이기에 receiver 컴포넌트를 제외한 모든 컴포넌트를 enabled: true 처리하고,
레플리카셋 형태로 배포되어 있는 Prometheus 서버들과의 연동을 위한 설정을 진행한다.
existingObjstoreSecret: "thanos-objstore-secret"
## @param existingObjstoreSecretItems Optional item list for specifying a custom Secret key. If so, path should be objstore.yml

query:
  # ...
  stores:
  # prometheus thanos sidecar service name
  - prometheus-kube-prometheus-thanos-discovery.prometheus.svc.cluster.local:10901


queryFrontend:
  enabled: true
  # ...
  config:
    type: IN-MEMORY
    config:
      max_size: 512MB
      max_size_items: 100
      validity: 120s

compactor:
  enabled: true
  # ...
  retentionResolutionRaw: 30d
  retentionResolution5m: 30d
  retentionResolution1h: 1y # 10y is too long
  persistence:
    ## @param compactor.persistence.enabled Enable data persistence using PVC(s) on Thanos Compactor pods
    ##
    enabled: false

storegateway:
  enabled: true
  # ...
  config:
    type: IN-MEMORY
    config:
      max_size: 300MB
      max_item_size: 120MB
  persistence:
    ## @param storegateway.persistence.enabled Enable data persistence using PVC(s) on Thanos Store Gateway pods
    ##
    enabled: false

ruler:
  enabled: true
  # ...
  alertmanagers:
    - http://prometheus-kube-prometheus-alertmanager.prometheus.svc.cluster.local:9093
  config:
    groups:
      - name: "metamonitoring"
        rules:
          - : "PrometheusDown"
            expr: absent(up{prometheus="monitoring/prometheus-operator"})
  persistence:
    ## @param ruler.persistence.enabled Enable data persistence using PVC(s) on Thanos Ruler pods
    ##
    enabled: false
서버가 비정상적으로 꺼지면 일부 데이터가 유실되는것을 감안하고 persistence 설정은 모두 enabled: false 처리한다.
Tempo
https://grafana.com/docs/tempo/latest/
https://grafana.com/docs/tempo/latest/setup/helm-chart/
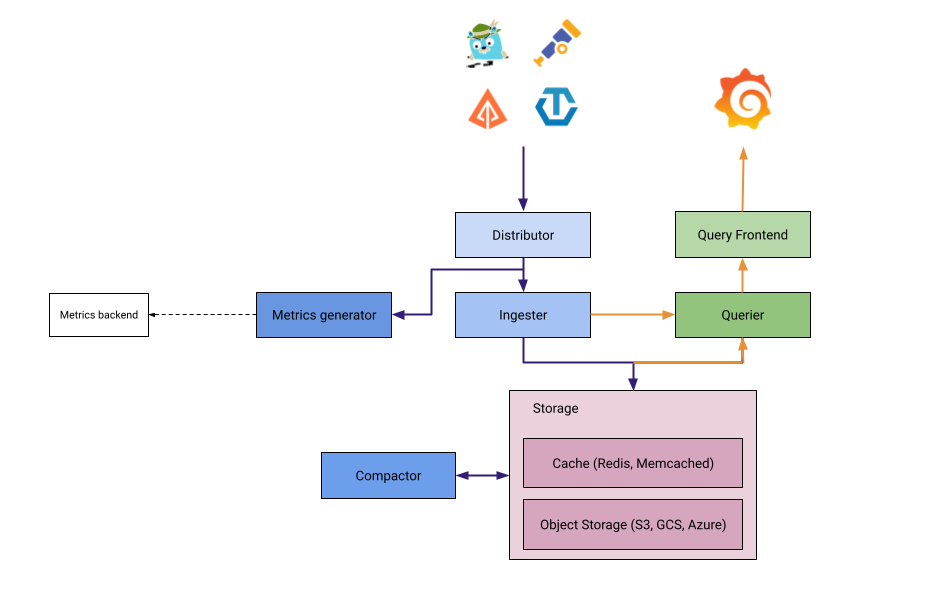
대용량 분산 추적 백엔드.
[Loki, Thanos] 처럼 대용량 데이터 처리를 위해 다양한 컴포넌트로 구성되어 MSA 형태로 운영할 수 있다.
Tempo Distributor 에서 [jeager, zipkin, otel] 등 다양한 포멧의 데이터를 입력받는다.
모놀리식 설치
https://github.com/grafana/helm-charts/tree/main/charts/tempo https://github.com/grafana/helm-charts/tree/main/charts/tempo-distributed
Grafana helm 차트에서 Tempo 의 모놀리식 방식, 마이크로서비스 방식을 모두 지원한다.
여기선 모놀리식(single binary mode) 방식을 사용.
helm repo add grafana https://grafana.github.io/helm-charts
helm search repo grafana

# 압축파일 다운로드, tempo-1.7.1.tgz 버전 설치됨, 모놀리식 버전
helm fetch grafana/tempo

# 압축 파일 해제
tar zxvf tempo-*.tgz
mv tempo tempo-helm
모놀리식 운영방식인 만큼 persistence 와 같은 추가설정 없이 동작되도록 되어있다.
service graph 작성을 위한 prometheus remote write 과 추적 데이터 저장을 위한 s3 에 대한 설정 진행.
tempo:
  # ...
  metricsGenerator:
  # -- If true, enables Tempo's metrics generator (https://grafana.com/docs/tempo/next/metrics-generator/)
  enabled: true
  remoteWriteUrl: "http://prometheus-kube-prometheus-prometheus.prometheus.svc.cluster.local:9090/api/v1/write"
  # ...
  storage:
    trace:
      # tempo storage backend
      # refer https://grafana.com/docs/tempo/latest/configuration/
      ## Use s3 for example
      backend: s3
      # store traces in s3
      s3:
        bucket: tempo                                   # store traces in this bucket
        endpoint: minio.minio.svc.cluster.local:9000    # api endpoint
        access_key: rootuser                            # optional. access key when using static credentials.
        secret_key: rootpass123                         # optional. secret key when using static credentials.
        insecure: true                                  # optional. enable if endpoint is http
      # backend: local
grafana
[Loki, Tempo, Thanos] 같은 시계열 데이터를 가지는 백엔드 서비스의 프론트엔드 역할
이 외에도 전통적인 [zipkin, jeager, prometheus] 백엔드 서비스와도 연동 가능하다.
설치
helm repo add grafana https://grafana.github.io/helm-charts
helm search repo grafana

# 압축파일 다운로드, grafana-7.2.5.tgz 버전 설치됨
helm fetch grafana/grafana

# 압축 파일 해제
tar zxvf grafana-*.tgz
mv grafana grafana-helm
Grafana 는 각종 설정이 Persistence 에 저장될 뿐 사실상 stateless 에 가깝다.
아래와 같이 pvc, ingress 설정만 하고 실행.
# ingress 설정
ingress:
  enabled: true
  annotations:
    kubernetes.io/ingress.class: nginx
    kubernetes.io/tls-acme: "true"
  labels: {}
  path: /

# storage class pvc 설정
persistence:
  type: pvc
  enabled: true
  storageClassName: "local-path"
helm install grafana -f values.yaml . -n monitoring
kubectl get secret --namespace monitoring grafana -o jsonpath="{.data.admin-password}" | base64 --decode ; echo
# strongpassword
chart-example.local 를 hosts 파일에 등록 후 접속진행
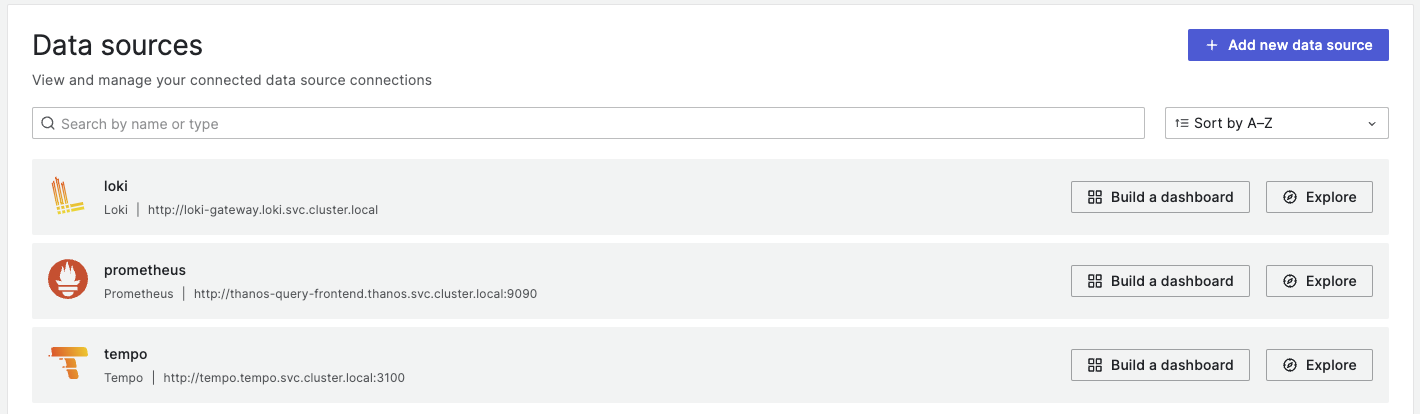
연동
기존에 설치한 [Loki, Temp, Thanos] 연동은 k8s CoreDNS 에서 제공하는 도메인을 사용해 연결하면 된다.