# my global config global: scrape_interval:15s# Set the scrape interval to every 15 seconds. Default is every 1 minute. evaluation_interval:15s# Evaluate rules every 15 seconds. The default is every 1 minute. # scrape_timeout is set to the global default (10s).
# Load rules once and periodically evaluate them according to the global 'evaluation_interval'. rule_files: # - "first_rules.yml" # - "second_rules.yml"
# A scrape configuration containing exactly one endpoint to scrape: # Here it's Prometheus itself. scrape_configs: # The job name is added as a label `job=<job_name>` to any timeseries scraped from this config. -job_name:"prometheus"
# metrics_path defaults to '/metrics' # scheme defaults to 'http'.
먼저 Prometheus 에 어떤 형식의 데이터가 계측데이터로 쌓이는지 알아야 한다. 계측라이브러리별로 사용하는 클래스명, 함수명이 다르지만 대부분 비슷하며, 여기선 java-micrometer 를 기준으로 설명한다.
1 2
// prometheus micrometer registry 등록 implementation "io.micrometer:micrometer-registry-prometheus"
메트릭 형식
1 2 3 4
# HELP jvm_gc_memory_promoted_bytes_total Count of positive increases in the size of the old generation memory pool before GC to after GC # TYPE jvm_gc_memory_promoted_bytes_total counter jvm_gc_memory_promoted_bytes_total{service_name="greeting",} 0.0 # 메트릭이름{레이블 key-value} 값 [time_stamp]
HELP 주석은 메트릭에 대한 설명, 수집할 때마다 변경되어서는 안됨, TYPE 주석은 [counter, gauge, summary, histogram, untyped] 중 하나의 값을 가진다. 주석 데이터는 Prometheus 의 연산에선 사용하지 않지만 Grafana 표시창에선 출력될 수 있다.
모든 문자열은 snake type 으로 구성되어야 하고, 아래와 같은 플랫폼과 타입에 해당하는 예약어를 메트릭이름이나 레이블 key 값으로 사용하지 않는것을 권장한다.
@GetMapping("/{num1}/{num2}") public String calculate(@PathVariable Long num1, @PathVariable Long num2) { log.info("calculate invoked, num1:{}, num2:{}", num1, num2); // 결과 값을 저장할 AtomicInteger 생성 result.set(num1 + num2); return result.toString(); }
1 2
curl localhost:8080/greeting/3/4 # 7
1 2 3
# HELP result_sum result sum # TYPE result_sum gauge result_sum{service_name="greeting",} 7.0
Summary
계측한 데이터의 수(count), 평균값(mean), 최대값(max), 합계(sum) 통계값을 제공한다.
# HELP request_num_size_num # TYPE request_num_size_num summary request_num_size_num_count{service_name="greeting",} 6.0 request_num_size_num_sum{service_name="greeting",} 21.0 # HELP request_num_size_num_max # TYPE request_num_size_num_max gauge request_num_size_num_max{service_name="greeting",} 6.0
Timers
이벤트 수행 시간을 측정. histogram 에 대한 내용을 출력, bucket 형태로 제공한다. 평균 시간, 최소/최대 시간, 카운트(작업 수), throughput 등의 정보를 제공.
// 작업 수행 후 Timer에서 정보 가져오기 Stringresult=""; result += "총 실행 횟수: " + timer.count() + "\n"; result += "평균 실행 시간(ms): " + timer.mean(TimeUnit.MILLISECONDS) + "\n"; result += "최대 실행 시간(ms): " + timer.max(TimeUnit.MILLISECONDS) + "\n"; result += "총 실행 시간(ms): " + timer.totalTime(TimeUnit.MILLISECONDS) + "\n"; return result; }
curl localhost:8080/greeting/record # 총 실행 횟수: 1 # 평균 실행 시간(ms): 1004.828625 # 최대 실행 시간(ms): 1004.828625 # 총 실행 시간(ms): 1004.828625 curl localhost:8080/greeting/record # 총 실행 횟수: 2 # 평균 실행 시간(ms): 1004.7607295 # 최대 실행 시간(ms): 1004.828625 # 총 실행 시간(ms): 2009.521459 curl localhost:8080/greeting/record # 총 실행 횟수: 3 # 평균 실행 시간(ms): 1003.3067086666666 # 최대 실행 시간(ms): 1004.828625 # 총 실행 시간(ms): 3009.920126 curl localhost:8080/greeting/record # 총 실행 횟수: 4 # 평균 실행 시간(ms): 1003.74377125 # 최대 실행 시간(ms): 1005.054959 # 총 실행 시간(ms): 4014.975085
Prometheus 출력값을 보면 분위수 측정을 위한 quantile 부터 _bucket 으로 범위를 지정해 빈도수를 측정할 수 있다.
1초 sleep 임으로 1초를 기점으로 누적히스터그램에 4 번 호출됨을 알수 있다.
꼭 Runnable 로 측정할 필요 없이 아래와 같이 실행시간에 대한 값만 입력해도 된다.
1 2 3 4 5
// 작업 시작 전 시간 측정 longstartTime= System.nanoTime(); Thread.sleep(1000); // 측정할 이벤트 longendTime= System.nanoTime(); timer.record(endTime - startTime, TimeUnit.NANOSECONDS);
AOP 를 사용하면 간단한 어노테이션으로 함수별, 함수그룹 Timer 측정 가능.
레이블
레이블은 시계열과 연관된 key-value 쌍으로 데이터 식별자로 사용된다.
1 2 3 4 5 6 7 8
# HELP jvm_memory_committed_bytes The amount of memory in bytes that is committed for the Java virtual machine to use # TYPE jvm_memory_committed_bytes gauge jvm_memory_committed_bytes{area="heap",id="G1 Eden Space",service_name="greeting",} 6.291456E7 jvm_memory_committed_bytes{area="heap",id="G1 Old Gen",service_name="greeting",} 4.194304E7 jvm_memory_committed_bytes{area="nonheap",id="CodeCache",service_name="greeting",} 1.0289152E7 jvm_memory_committed_bytes{area="nonheap",id="Metaspace",service_name="greeting",} 5.6623104E7 jvm_memory_committed_bytes{area="heap",id="G1 Survivor Space",service_name="greeting",} 8388608.0 jvm_memory_committed_bytes{area="nonheap",id="Compressed Class Space",service_name="greeting",} 7798784.0
위와 같이 메트릭이름이 동일하더라도 레이블을 통해 PromQL 를 통해 다양한 집계연산이 가능하다.
레이블을 설정시 중복의미를 피해야한다. PromQL 를 사용해 대부분 집계연산이 가능하기에 중복의미의 값이 Prometheus 에 저장되는것을 피해야한다.
이 외에도 action 속성을 사용해 target label 관련 여러가지 작업 수행이 가능하다.
PromQL
백터 선택기
백터 선택기 는 PromQL 로 메트릭을 조회할 때 사용하는 쿼리 조회기라 할 수 있다, 각종 검색 조건을 설정할 수 있고, 출력하려는 데이터(벡터) 형태에 따라 2가지로 나뉜다.
인스턴트 벡터 선택기
범위 벡터 선택기
1 2 3 4
# 인스턴트 벡터 선택기 jvm_threads_states_threads{service_name='greeting', state='runnable'} # 범위 벡터 선택기 jvm_threads_states_threads{service_name='greeting', state='runnable'}[5m]
백터 선택기 내부에서 사용되는 연산자를 matcher 라 부르며 아래 4가지가 연산이 가능하다.
인스턴트 벡터는 특정 시점에서의 메트릭 값들의 집합이다. PromQL 을 사용하여 데이터를 조회하거나 연산할 때 기본적으로 다루어지는 데이터 형식이다.
인스턴트 벡터 선택기를 통해 조회된다.
만약 메트릭이 과거에는 수집되었었지만 현재는 더이상 수집되지 않고 멈춰있다면, 쿼리조회 결과로 동일한 값들을 인스턴트 벡터로 출력시킬 것이다. 따라서 더이상 수집되지 않는 메트릭은 스테일 마커(stale marker) 를 사용해 인스턴트 벡터로 취급하지 않으며 쿼리조회 결과에서 제외시키는 과정을 수행한다.
stalenesss 과정이라 부름.
스테일 마커 의 처리는 내부 로직에 의해 자동으로 이루어지며, 데이터베이스에서 자동으로 제거해 리소스를 확보한다.
1 2 3 4 5 6 7 8 9 10
# 인스턴트 벡터 조회 jvm_threads_states_threads{service_name='greeting'}
# 조회 결과, 수집된 인스턴트 벡터 jvm_threads_states_threads{service_name="greeting",state="runnable"} 12.0 jvm_threads_states_threads{service_name="greeting",state="terminated"} 0.0 jvm_threads_states_threads{service_name="greeting",state="new"} 0.0 jvm_threads_states_threads{service_name="greeting",state="blocked"} 0.0 jvm_threads_states_threads{service_name="greeting",state="waiting"} 23.0 jvm_threads_states_threads{service_name="greeting",state="timed-waiting"} 15.0
범위 벡터
Gauge 형태의 데이터를 최신 한건 보여줄 때에나 인스턴트 백터 를 사용하고, 그래프 형태의 데이터를 출력할 땐 범위로 메트릭을 조회한다.
1 2 3 4 5 6 7 8 9 10
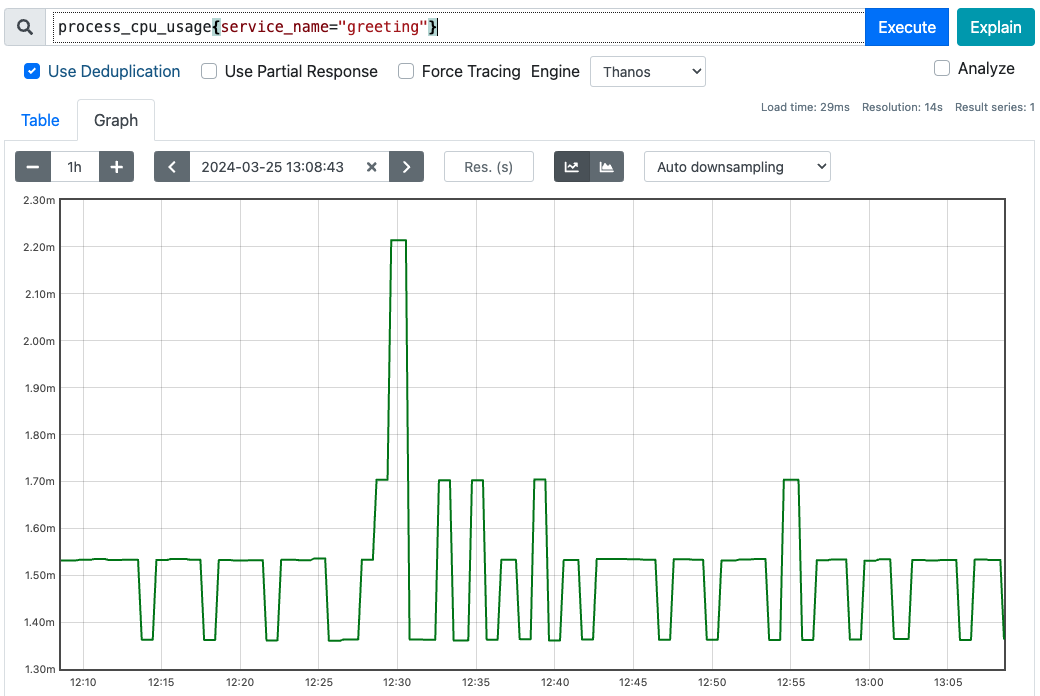
# 범위 벡터 조회 process_cpu_usage{service_name="greeting"}[5m]
# 조회 결과, 5분 동안의 범위 벡터 process_cpu_usage{service_name="greeting"} 0.0015325453023316401 @1711339473.398 # 1분 단위로 5개 반환 0.0013616055598816446 @1711339533.398 0.0015336334332262665 @1711339593.398 0.0015323496027067837 @1711339653.398 0.0013628039691665603 @1711339713.398
대시보드에서 graph탭을 누르면 각 시간대별로 메트릭값을 볼 수 있도록 범위 조회를 진행한다. 아래와 같이 범위 벡터 를 검색해서 출력해준다.
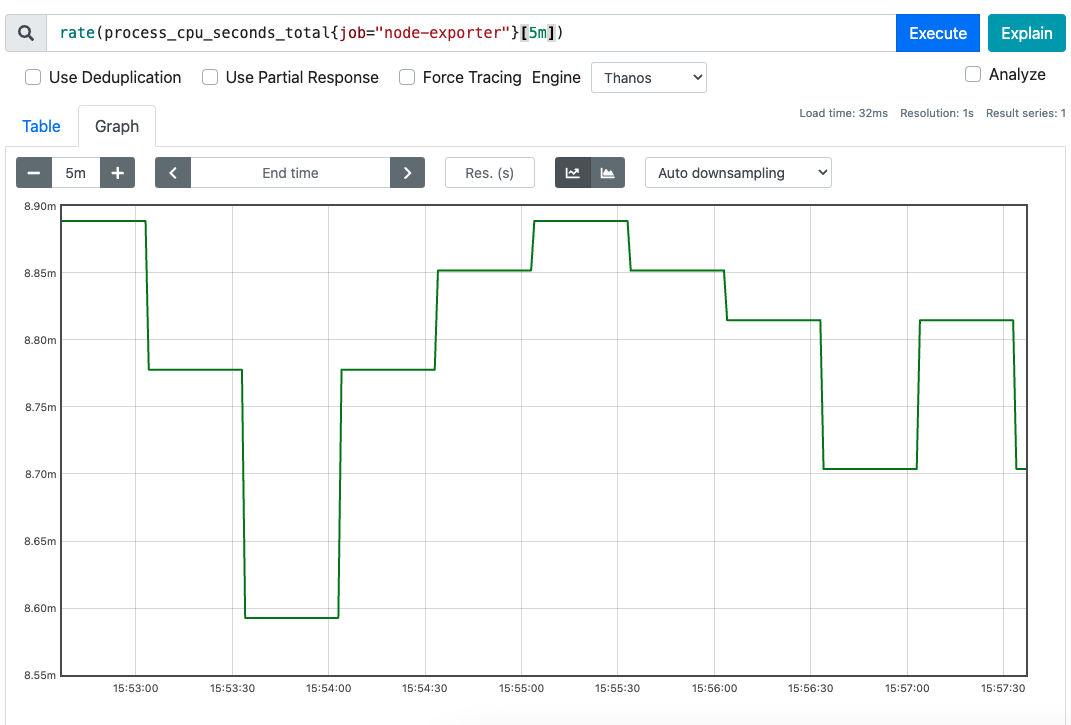
rate, avg_over_time 등, 함수가 범위벡터를 파라미터로 요구할 수 있다. Counter 메트릭를 범위벡터로 rate 함수에 전달하면 아래와 같이 그래프로 표기해준다.
집계연산자
PromQL 에서 제공하는 집계연산으로 [sum, avg, max, min, count] 등이 있다.
집계연산은 상태를 측정하는 Gauge 메트릭을 측정할 때 주로 사용한다.
집계연산은 항상 그룹화를 거쳐야 한다. 그룹화를 위한 함수는 아래 2개
by: 해당 속성을 기준으로 그룹화
whitout: 해당 속성을 제외하여 그룹화
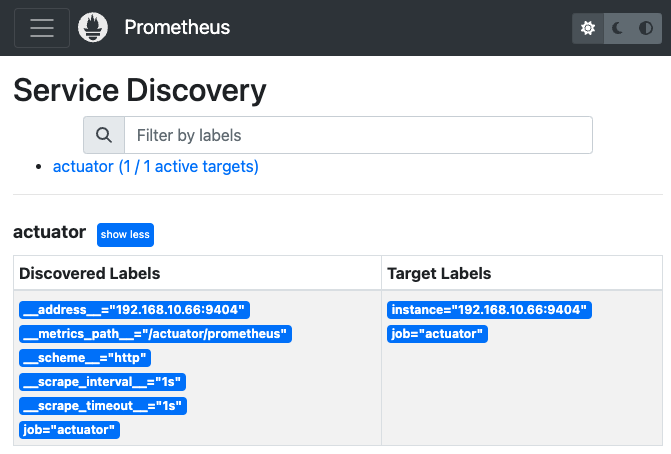
아래와 같이 2개의 Spring Boot actutator 서버에서 메트릭을 뽑아냈을 때,
1 2 3 4 5 6 7 8
# HELP jvm_threads_states_threads The current number of threads # TYPE jvm_threads_states_threads gauge jvm_threads_states_threads{service_name="greeting",state="runnable"} 12.0 jvm_threads_states_threads{service_name="greeting",state="terminated"} 0.0 jvm_threads_states_threads{service_name="greeting",state="new"} 0.0 jvm_threads_states_threads{service_name="greeting",state="blocked"} 0.0 jvm_threads_states_threads{service_name="greeting",state="waiting"} 23.0 jvm_threads_states_threads{service_name="greeting",state="timed-waiting"} 15.0
1 2 3 4 5 6 7 8
# HELP jvm_threads_states_threads The current number of threads # TYPE jvm_threads_states_threads gauge jvm_threads_states_threads{service_name="calculating", state="blocked"} 0.0 jvm_threads_states_threads{service_name="calculating", state="new"} 0.0 jvm_threads_states_threads{service_name="calculating", state="runnable"} 11.0 jvm_threads_states_threads{service_name="calculating", state="terminated"} 0.0 jvm_threads_states_threads{service_name="calculating", state="timed-waiting"} 13.0 jvm_threads_states_threads{service_name="calculating", state="waiting"} 28.0
같은 이름을 가진 여러개의 메트릭이 있을경우, 개별 그래프로 출력시킬 수 있고 그룹화하여 출력시킬 수도 있다.
by 그룹화 연산자를 사용해 sum 집계연산을 진행.
1 2 3 4 5 6 7
# service_name 레이블 기준으로 집계 sum by(service_name)(jvm_threads_states_threads)
# 조회 결과 # 현 시점에는 각 서비스별로 52, 46 개의 스레드가 동작중이라 할 수 있다. {service_name="calculating"} 52 {service_name="greeting"} 46
jvm_threads_states_threads 의 경우 속성이 2개밖에 없기 때문에 by(service_name) 은 whitout(state) 와 동일하다.
이 외에도 topk, bottomk, quantile, count_values 등의 집계연산자가 존재한다.
topk, bottomk 은 각각 상위, 하위 N개 메트릭을 반환하는 함수
1 2 3 4 5 6 7 8 9 10 11 12 13 14 15
# 상위 2개에 대한 메트릭, state 를 제외하고 그룹화 topk without(state)(2, jvm_threads_states_threads) # 조회 결과, 각 서비스별 상위 2개씩 반환 jvm_threads_states_threads{service_name="calculating", state="waiting"} 28 jvm_threads_states_threads{service_name="calculating", state="timed-waiting"} 13 jvm_threads_states_threads{service_name="greeting", state="waiting"} 23 jvm_threads_states_threads{service_name="greeting", state="timed-waiting"} 13
# 하위 2개에 대한 메트릭, state 를 제외하고 그룹화 bottomk without(state)(2, jvm_threads_states_threads) # 조회 결과, 각 서비스별 하위 2개씩 반환 jvm_threads_states_threads{service_name="calculating", state="blocked"} 0 jvm_threads_states_threads{service_name="calculating", state="new"} 0 jvm_threads_states_threads{service_name="greeting", state="blocked"} 0 jvm_threads_states_threads{service_name="greeting", state="new"} 0
quantile 은 분위수를 측정하여 반환하는 함수
1 2 3 4 5 6 7 8 9
# 0.5 분위수 반환, 평군과 동일 quantile without(device) (0.5, node_network_receive_bytes_total)
# 출력된 value 기준으로 카운팅, 속성명은 my_envoy_version 으로 count_values without(instance)("my_envoy_version", envoy_server_version) # 카운트 결과 {job="envoy-stats", my_envoy_version="3203603"} 13
# 총 몆종류의 my_envoy_version 이 있는지 확인 count without(my_envoy_version) ( count_values without(instance)("my_envoy_version", envoy_server_version) ) {job="envoy-stats"} 1
산술연산자
지금까지는 프로메테우스의 반환값은 모두 vector 형태였다.
산술연산(사칙연산)을 수행시 scalar 형태의 데이터를 사용하고, PromQL 에서 제공하는 각종 함수 파라미터로 요구하는 경우가 많다.
vector() scalar to vector
scalar() vector to scalar
1 2 3 4 5
vector(0) # {} 0
scalar(vector(1)) # scalar 1
vector 데이터는 아래와 같이 or 연산자와 함께 값이 없을경우 0 을 반환하도록 사용한다.
1 2
sum(not_exist_guage) or vector(0) # {} 0
vector 와 scalar 모두 산술연산과 비교연산을 지원한다.
+ 덧셈
- 뺄셈
* 곱셈
/ 나눗셈
% 모듈러연산
^ 지수연산
== 같다
!= 같지 않다
> 보다 크다
< 보다 작다
>= 보다 크거나 같다
<= 보다 작거나 같다.
1 2 3 4 5 6
scalar(vector(1)) * 4 # scalar 4
process_resident_memory_bytes / 1024 (process_resident_memory_bytes / 1000) > 1048 * 4 # 4GB 이상 벡터 필터링
Counter 관련 함수
rate
irate
increase
세 함수 모두 증감율을 측정할 수 있는 PromQL 함수, 계속 증가하는 Counter 메트릭을 측정할 때 주로 사용한다.
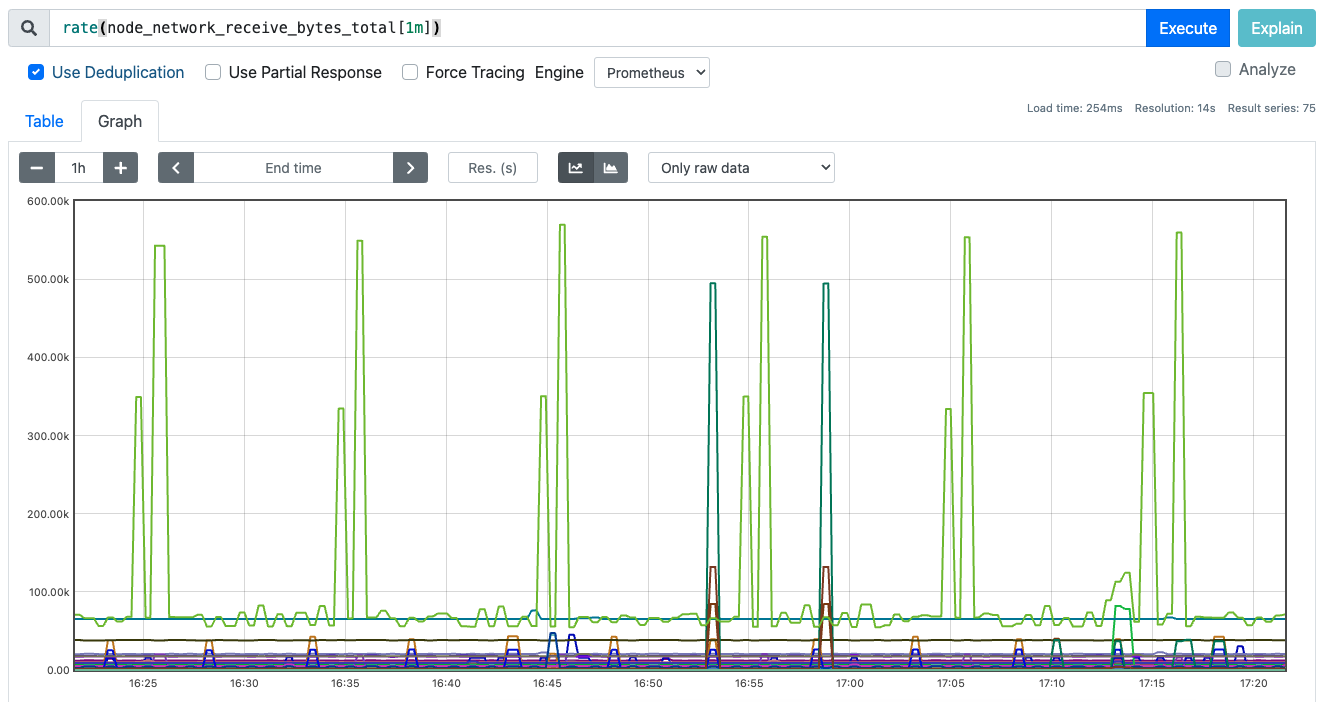
1 2
# k8s node 의 receive bytes 측정 rate(node_network_receive_bytes_total[1m])
1 2
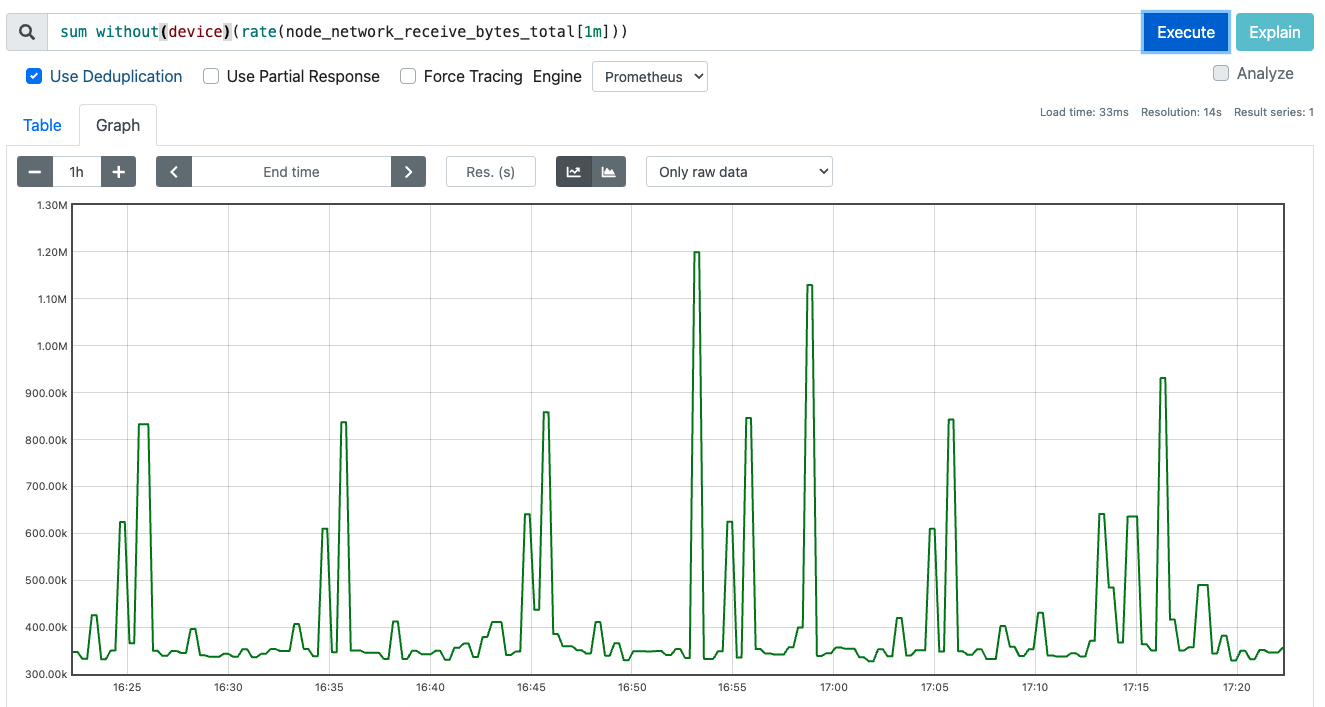
# k8s node 의 receive bytes 측정 후 모드 합하기 sum without(device)(rate(node_network_receive_bytes_total[1m]))
increase 는 rate 의 편의문법으로 rate 결과에 곱하기 300 한것과 동일하다.
irate 는 범위벡터로 출력된 모든값을 사용하지 않고 두 샘플만 사용한다.
Gauge 관련 함수
changes
deriv
predict_linear
delta
idelta
holt_winters
시간함수
time
year
month
days_in_month
days_of_month
days_of_week
hour
minute
time 함수만 유일하게 scalar 형태의 데이터를 반환한다.
1 2 3 4 5
time() # scalar 1711428748
year(vector(1711428748)) # {} 2024
수학함수
제공되는 모든 수학함수의 반환값은 vector 형태이다. 입력 파라미터로는 scalar 형태를 요구한다.
abs
sqrt
ln
log2
log10
exp
ceil
floor
round
clamp_min
clamp_max
벡터 매칭
두 메트릭의 결과 벡터의 레이블이 정확히 동일하여 1:1 매핑 가능하다면 산술연산이 가능하다.
1
process_open_fds / process_max_fds
결과 벡터의 레이블이 정확히 동일하지 않더라도 일부 레이블을 무시하고 매칭시킬 수 있다.
1 2 3 4 5 6 7
# 조회 및 결과 sum without(cpu)(rate(node_cpu_seconds_total{mode="idle"}[5m])) {job="node-exporter", mode="idle", } 10.27699999999669
# 조회 및 결과 sum without(mode, cpu)(rate(node_cpu_seconds_total[5m])) {job="node-exporter"} 11.743407407403625
위의 두 집계연산자의 결과 밑의 벡터는 mode 레이블 이 존재하지 않아 서로 일치하지 않지만 mode 레이블 를 제외시켜 매칭시킬 수 있도록 한다.
우측에 일부 레이블이 존재하지 않더라도 ignoring 을 통해 맞지 않는 레이블은 제거하고 매칭시킨다.
1 2 3 4 5
sum without(cpu)(rate(node_cpu_seconds_total{mode="idle"}[5m])) / ignoring(mode) sum without(mode, cpu)(rate(node_cpu_seconds_total[5m])) {job="node-exporter", service="prometheus-prometheus-node-exporter"} 0.8699777650560057
반대로 특정 레이블만 가지고 매칭시키려면 on 을 사용한다. 우측에 해당 레이블이 존재만 한다면 매칭시킨다.
1 2 3
sum without(cpu)(rate(node_cpu_seconds_total{mode="idle"}[5m])) / on(cpu) sum(rate(node_cpu_seconds_total[5m]))
ignoring, on 모두 좌측과 우측에서 출력된 결과 벡터의 개수가 동일해야 매칭된다.
좌측에선 N건, 우측에선 M건 검색될 경우 매칭되지 않는데 이를 위해 두개의 결과 벡터를 조인처리해줄 함수를 사용한다.
1 2 3 4 5 6 7
sum without(cpu)(rate(node_cpu_seconds_total[5m])) # 검색결과 N건 / ignoring(mode) group_left sum without(mode, cpu)(rate(node_cpu_seconds_total[5m])) # 검색셜과 1건
node_hwmon_temp_celsius # 검색결과 N건 * ignoring(label) group_left(label) node_hwmon_sensor_label # 검색결과 M건, N != M
우측 피연산자 결과 벡터의 개수가 1개라면, 좌측 피연사자의 모든 결과 벡터에 적용시킬 수 있다. 좌측 N, 우측 M, 그리고 N != M 관계일경우 일부 N 의 경우 매칭되는 벡터가 없을것이다. 그땐 좌측의 일부 결과 벡터를 버리고 매칭되는 벡터끼리 연산한 것만 출력한다.
논리연산자 백터 매칭
2개의 결과 벡터를 매칭하는 방법, 아래 논리연산자를 통해 벡터 매칭이 가능.
or
and
unlsess
1
2
3
4
5
6
7
8
9
10
11
12
13
14
# label ignoring 하고 매핑, or 연산자로 레이블이 일치하지 않아도 그냥 출력
node_hwmon_sensor_label
or ignoring(label)
node_hwmon_temp_celsius

# 조회결과 or 로 인해 마지막에 node_hwmon_temp_celsius 가 출력됨
node_hwmon_sensor_label{label="Core 0", namespace="prometheus",sensor="temp2"} 1
node_hwmon_sensor_label{label="Core 1", namespace="prometheus",sensor="temp3"} 1
node_hwmon_sensor_label{label="Core 2", namespace="prometheus",sensor="temp4"} 1
node_hwmon_sensor_label{label="Core 3", namespace="prometheus",sensor="temp5"} 1
node_hwmon_sensor_label{label="Core 4", namespace="prometheus",sensor="temp6"} 1
node_hwmon_sensor_label{label="Core 5", namespace="prometheus",sensor="temp7"} 1
node_hwmon_sensor_label{label="Package id 0", namespace="prometheus",sensor="temp1"} 1
node_hwmon_temp_celsius{sensor="temp1", }
# alertmanager.yaml global: smtp_smarthost:'smtps.hiworks.com:465'# 이메일 서버 주소와 포트 smtp_from:'alertmanager@demo.com'# 발신자 주소 smtp_auth_username:'myaddress@demo.com'# SMTP 인증을 위한 사용자 이름 smtp_auth_password:'xxxxx'# SMTP 인증을 위한 비밀번호 smtp_require_tls:false# TLS 요구 여부
templates: -'/etc/alertmanager/template/*.tmpl'# 템플릿 파일 경로 추가
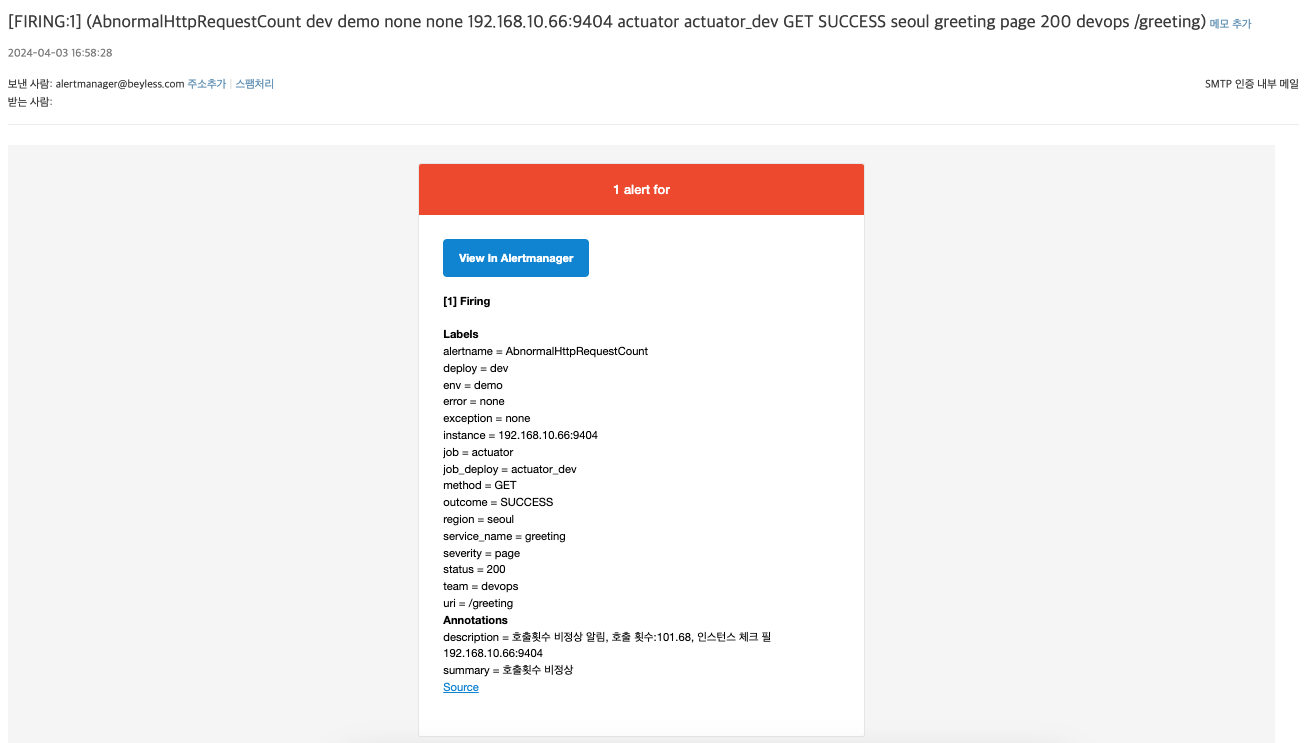
<!-- email.html --> {{ define "custom_mail_subject" }} Alert on {{ range .Alerts.Firing }}{{ .Labels.instance }} {{ end }}{{ if gt (len .Alerts.Firing) 0 }}{{ if gt (len .Alerts.Resolved) 0 }} & {{ end }}{{ end }}{{ range .Alerts.Resolved }}{{ .Labels.instance }} {{ end }} {{ end }}
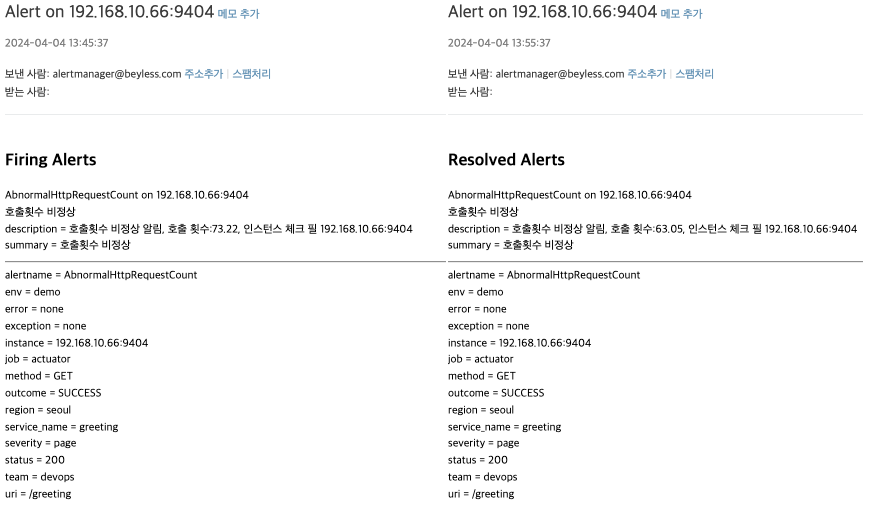
{{ define "custom_mail_html" }} <html> <head> <title>Alert!</title> </head> <body> {{ if gt (len .Alerts.Firing) 0 }} <h2>Firing Alerts</h2> {{ range .Alerts.Firing }} <p>{{ .Labels.alertname }} on {{ .Labels.instance }}<br/> {{ if ne .Annotations.summary "" }}{{ .Annotations.summary }}<br/>{{ end }} {{ range .Annotations.SortedPairs }}{{ .Name }} = {{ .Value }}<br/>{{ end }}</p> {{ end }} {{ end }}
{{ if gt (len .Alerts.Resolved) 0 }} <h2>Resolved Alerts</h2> {{ range .Alerts.Resolved }} <p>{{ .Labels.alertname }} on {{ .Labels.instance }}<br/> {{ if ne .Annotations.summary "" }}{{ .Annotations.summary }}<br/>{{ end }} {{ range .Annotations.SortedPairs }}{{ .Name }} = {{ .Value }}<br/>{{ end }}</p> <hr /> {{ end }} {{ end }} <hr /> <p> {{ range $key, $value := .CommonLabels }} {{ $key }} = {{ $value }}<br/> {{ end }} </p> </body> </html> {{ end }}
통보에 사용할 메세지 형식을 template 으로 미리 만들어두고 사용할 수 있으며 go 템플릿 문법을 사용한다. template 문법은 아래 url 참고.